 |
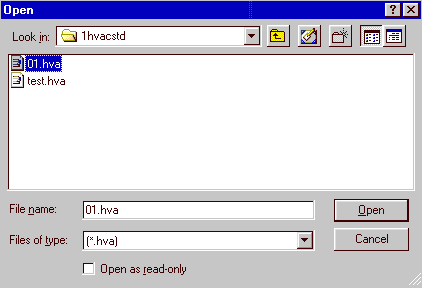
Now click Gnatt Chart / Cash Flow option. A new window will appear as follows, asking for the file name. |
 |
 |
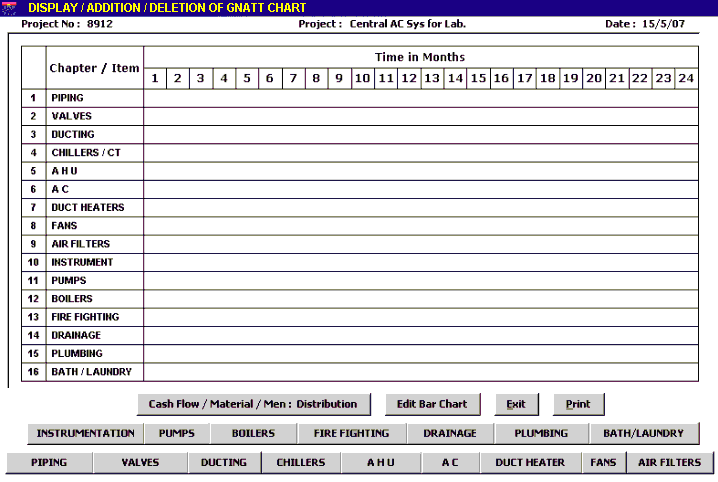
Now click " 01 " file & click open. A new window will appear as follows, showing empty Gnatt / Bar Chart. |
 |
 |
Now let us start constructing Gnatt / Bar Chart.
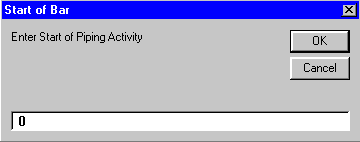
Click " Piping " button situated at the left bottom corner of chart. The following window will appear asking for " Enter Start of
Piping ". Type 0 & press " OK ". |
 |
 |
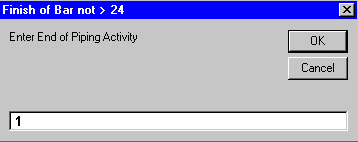
Again a new window will appear asking for " Enter End of
Piping ". Type 1 & press " OK ". This window is displayed as under. |
 |
 |
Now you will see a RED BAR is displayed between
0 and 1 on the
" Piping " ROW.
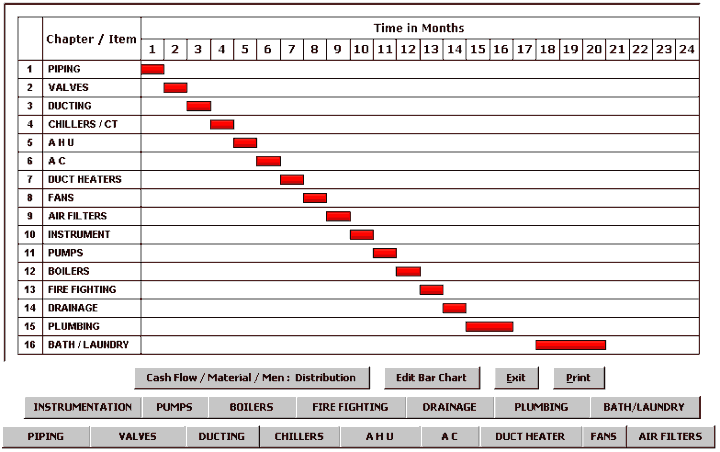
Similarly you can prepare the complete GNATT / BAR CHART by clicking various activity buttons such as
Valves, Ducting, AHU etc.... I have completed the BAR CHART for the whole project as follows. |
 |
 |
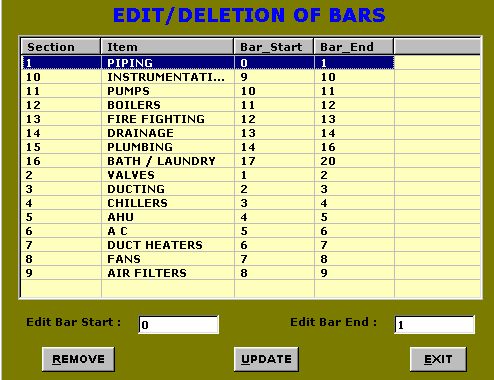
In case you have made any mistake or wants to change the Bar Chart, just click
" Edit Bar Chart " button. Following window will appear. |
 |
 |
Just Edit Bar Start or Edit Bar End and click on UPDATE button to register changes.
Note that bar end should always be greater then bar start.
If you want to delete any activity, (BAR) just take mouse to that ROW & click (select) and press the " REMOVE " button. Now you will notice that the selected activity has disappeared from this edit menu as well as the corresponding RED BAR has also been removed from the BAR CHART.
Click Exit. |
 |
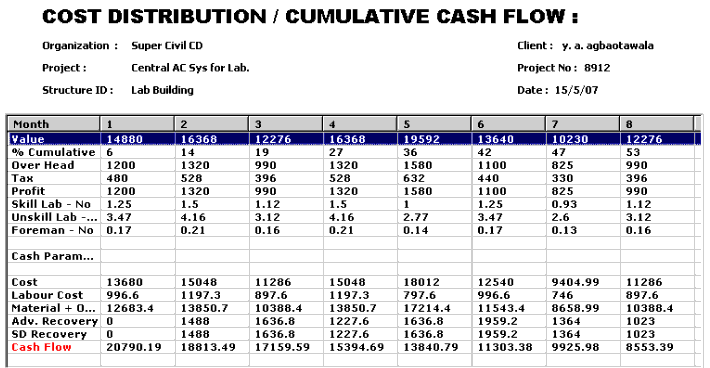
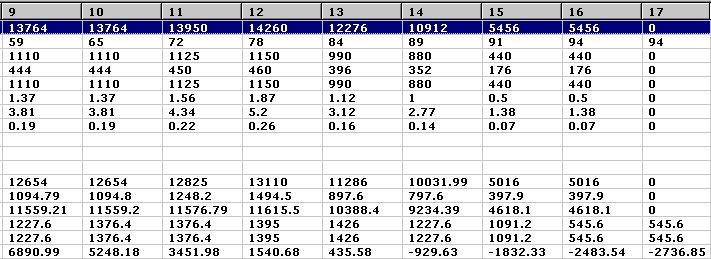
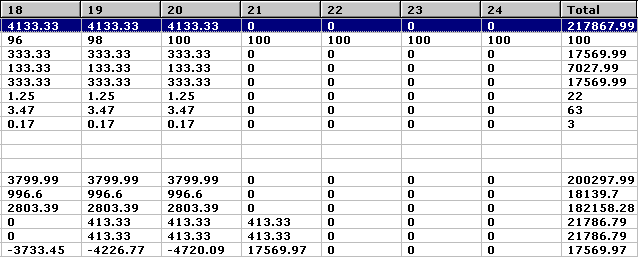
Click on the " Cash Flow / Material / Men distribution : " Button to display these parameters. A new window will appear as shown in following 3 nos. of graphics. |
 |
 |
 |
 |
The project duration of maximum of 24 months is allowed at a time.
Note that Cash Flow / Material / Men distribution is entirely dependent on Gnatt Chart.
If you prepare a Bar Chart of 12 months duration & only few required activities then
Cash Flow / Material / Men distribution will correspond to 12 months duration & those selected activities. |
 |
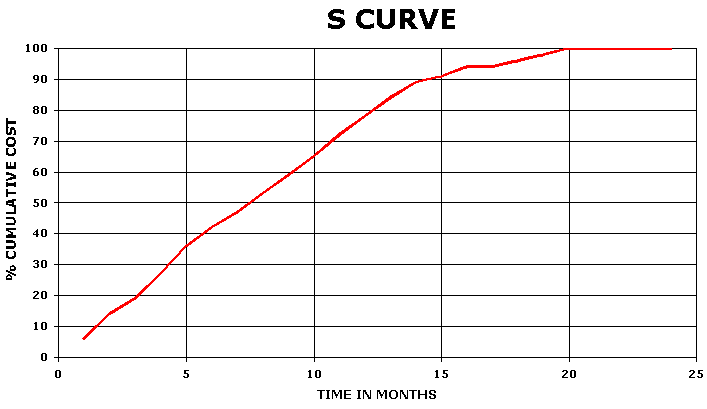
Lastly Click on the " S CURVE " button. The " S CURVE " will be displayed as under. |
 |
 |
Click EXIT " 3 " times to return to main menu. |
| STEP NO. 12 IS OVER. |
|
|


|


